


LOCKED OUT
A Report on Springfield, Missouri’s Eviction Crisis
Table of Contents
(click on a link to jump to that section)
Section I: Springfield’s Eviction Landscape
Springfield has 42,595 renter households, approximately 55% of all occupied households in the city¹². In 2025, landlords filed 2,292 eviction cases against those households¹³. That is a filing rate of 5.38%—roughly one eviction filing for every 19 renter households in the city.
The filing rate is not evenly distributed. Some City Council zones (referred to as “districts” in the Eviction Lab data) see twice the eviction pressure of others. And a small number of landlords account for a disproportionate share of the cases. This section describes those patterns.
Filing trends, 2020-2025
Eviction filings in Springfield rose sharply after 2021, when pandemic-era eviction moratoriums and rental assistance programs ended. In 2020, the city recorded 1,660 filings across all four City Council zones¹⁴. By 2025, that number had risen to 2,292—a 38% increase in five years. The trend has not reversed: through the partial 2026 data available at the time of this report, filings continue at pace consistent with 2025.
City Council zone-level analysis
Eviction filings are not evenly distributed across Springfield’s four City Council zones. The tables and charts below show filings and filing rates by zone from 2020 through 2025, with partial 2026 data.
| District | 2020 | 2021 | 2022 | 2023 | 2024 | 2025 | 2026 YTD |
|---|---|---|---|---|---|---|---|
| 1 | 549 | 578 | 586 | 661 | 599 | 571 | 65 |
| 2 | 439 | 464 | 511 | 544 | 612 | 611 | 83 |
| 3 | 409 | 420 | 576 | 648 | 596 | 733 | 96 |
| 4 | 262 | 280 | 396 | 401 | 410 | 377 | 56 |
| District | 2020 | 2021 | 2022 | 2023 | 2024 | 2025 | 2026 YTD |
|---|---|---|---|---|---|---|---|
| 1 | 6.97% | 7.33% | 7.43% | 8.39% | 7.60% | 7.24% | 0.82% |
| 2 | 4.16% | 4.40% | 4.84% | 5.15% | 5.80% | 5.79% | 0.79% |
| 3 | 2.80% | 2.87% | 3.94% | 4.43% | 4.08% | 5.02% | 0.66% |
| 4 | 2.63% | 2.81% | 3.97% | 4.02% | 4.11% | 3.78% | 0.56% |
Zone 1 has the highest filing rate every year. Since 2020, Zone 1’s filing rate has ranged from 6.97% to 8.39%, consistently the highest in the city. In 2025, 7.24% of renter households in Zone 1 faced an eviction filing, nearly double Zone 4’s rate of 3.78%.
Zone 2 grew steadily. Zone 2’s filing rate rose every year from 2020 to 2024—from 4.16% to 5.80%—before leveling off in 2025 at 5.79%. Unlike Zone 1 (which peaked in 2023 and declined) and Zone 3 (which dipped in 2024 before surging), Zone 2’s upward trend was consistent. Its raw filings also grew from 439 in 2020 to 611 in 2025.
Zone 3 is the fastest growing. Zone 3’s filing rate nearly doubled from 2.80% in 2020 to 5.02% in 2025, and its raw filings grew from 409 to 733, a 79% increase. Zone 3 now files more evictions than any other zone.
The 2022 inflection point. Every zone saw a sharp increase in filings between 2021 and 2022, the year pandemic-era protections ended. Zone 4’s filings jumped from 280 to 396 (a 41% increase); Zone 3’s from 420 to 576 (37% increase). The filing rate has not returned to pre-2022 levels in any zone.

Springfield’s eviction rate has increased 38% over the last five years.
Serial filings
A serial filing is a filing against a household that has already been filed against at least once. Springfield’s serial filing rate is 14.02% over the most recently available two-year period (March 1, 2024 to March 1, 2026): 4,431 filings were made against 3,694 unique households, with 518 households receiving more than one filing. Nearly one in seven eviction filings is against a household that has been through the process before.
A study published in Social Forces (a peer-reviewed sociology journal published by Oxford University Press) found that serial filings are often not attempts to remove tenants, but a way to use the courts to collect rent and fees. Property managers in high-filing cities knew tenants could usually make rent even after an eviction was filed, yet filed repeatedly to collect rent and additional fees. The practice was common where the eviction process was fast and cheap, and where monthly rent deadlines clashed with tenants’ pay schedules—a mismatch that produces routine, predictable late payments. Each filing added roughly $180 in fines and fees to the tenant’s bill, raising their monthly housing cost by about 20%¹⁵.
A serial filing typically asks the court for possession as well as rent, but the landlord’s goal is often collection, not removal. The tenant staying in the unit is compatible with the business model: the filing generates fees, and the tenant pays to remain. The possession claim is leverage, not necessarily the desired outcome. Serial filings work, in part, because the tenant does not appear in court, or does not know how to respond. The landlord collects a default judgment, the fees stack, and the case is on the tenant’s record. A lawyer changes that calculation: they appear, file the correct answer, and force a real negotiation rather than a default. Kansas City’s RTC program reduced default judgments from 45.9% to 37.5%.¹⁶ A tenant with counsel is a different proposition for a landlord deciding whether to file again.
Rental assistance alone does not break this cycle. A tenant who is one month behind may qualify for assistance, but the filing has already happened, the fees have already accrued, and the case is already on their record. A lawyer can challenge the fees, negotiate the underlying debt, and connect the tenant to rental assistance before the next filing—removing the landlord’s pretext for filing again. In Kansas City, 68% of resolved RTC cases ended in dismissal, judgment for the tenant, or settlement, compared to pre-program estimates that 99% of tenants were evicted.¹⁷ When the immediate crisis is resolved and the tenant has representation, serial filing loses its appeal as a collection mechanism.
Total eviction filings, citywide, by city council zone
Total eviction filings, citywide, by city council zone
The first map shows total filings concentration by zone: Zone 3 has the most (733 filings), followed by Zone 2 (611 filings), Zone 1 (571 filings), and Zone 4 (377 filings). Raw volume and per-household intensity point to different City Council zones.
Where filings concentrate within City Council zones
The citywide maps above show which zones have the most total filings and the highest serial eviction filing rates. The four maps below show census-tract-level concentration in each zone.
Zone 1
Zone 2
Zone 3
Zone 4
In every zone, filings are not spread evenly across census tracts—they concentrate in specific neighborhoods. These are the tracts where eviction pressure is highest and where RTC would have the greatest impact.
Top Evictors, 2025
The Eviction Lab provided STUN with a list of the most frequent eviction filers in Springfield for the period April 1, 2025 to March 31, 2026¹⁸. The list includes all properties with 15 or more filings during that period. A single owner or management company may appear more than once if they filed evictions at multiple properties.
| Rank | Evictor | Address | Filings |
|---|---|---|---|
| 1 | Occidental Development LLC | 3110 S Jefferson Ave | 74 |
| 2 | Investors Management and Marketing, Inc. | 2601 N Cresthaven Ave | 57 |
| 3 | Slate Westwood, LLC | 1131 W Battlefield St | 53 |
| 4 | Entrust Property Solutions, LLC | 2150 S Ingram Mill Rd | 37 |
| 5 | Southwood Properties | 1257 E Cherry St | 34 |
| 6 | Battlefield Park Apartments, LLC | 3020 S Sagamont Ave | 32 |
| 7 | Southwood Properties | 664 S Kentwood Ave | 30 |
| 8 | Coryell Courts Apartments, LLC | 2020 E Kerr St | 29 |
| 9 | Entrust Property Solutions, LLC | 1440 W Lark St | 28 |
| 10 | The Wooten Company, LLC | 2072 E Bennett St | 22 |
| 11 | The Wooten Company, LLC | 2444 N Delaware Ave | 17 |
| 12 | Cresco Springfield, LLC | 310 N Jefferson Ave | 16 |
| 13 | Entrust Property Solutions, LLC | 1306 N Frisco Ave | 15 |
| 14 | Entrust Property Solutions, LLC | 1655 S Ingram Mill Rd | 15 |
| 15 | Ghan & Cooper Multifamily, LLC | 3038 W Deerfield St | 15 |
| 16 | Investors Management and Marketing, Inc. | 1825 E Republic Rd | 15 |
Several entities appear multiple times under different property addresses. When filings are aggregated by owner, Entrust Property Solutions LLC is the largest eviction filer in Springfield, with 95 filings across four properties. That is more than Occidental Development LLC’s 74 filings at a single property, even though Occidental appears at rank 1 on the property-level list. Investors Management and Marketing, Inc. filed 72 evictions across two properties, Southwood Properties filed 64 across two, and The Wooten Company filed 39 across two.
Together, these four owners account for 270 of the 489 filings attributed to the top 16 properties on this list, roughly 55% of the total. A small number of corporate landlords account for a substantial share of eviction filings in Springfield.
This concentration matters for policy design. RTC programs in other cities have found that early legal intervention—particularly in cases involving repeat filers—can divert cases from eviction judgments to settlements or dismissals.

Entrust Property Solutions LLC, owned by Springfield Apartment and Housing Association president Brent Brown, is the largest eviction filer in Springfield.
Section II: Court Watch Findings
From May 19, 2026 to September 1, 2026, STUN trained community volunteers to observe eviction court proceedings in person at the Greene County circuit court. Across the observation period, volunteers observed 142 eviction cases. The findings show a system in which tenants are overwhelmingly under-resourced and alone.
Methodology: Court Watch
When: May 19, 2026 - September 1, 2026
Where: Greene County circuit court, Springfield, MO
Who: STUN-trained community volunteers
How cases were selected: Volunteers attending hearings based on their availability. Cases were not randomly sampled.
What was recorded: Presence or absence of legal representation for both parties, approximate hearing duration, and qualitative notes on the proceedings.
What this data is and isn’t: The findings describe what occurred in the 142 cases volunteers observed. They are not a statistical estimate of all eviction cases filed in Springfield during the period. The court watch was designed to document how eviction court functions for unrepresented tenants, not to produce a representative sample. It is, however, to our knowledge, one of the few detailed accounts.
Case types observed: 135 Rent and Possession, 7 Unlawful Detainer
Representation
In 141 of the 142 observed cases, the tenant had no attorney. Landlords had legal representation in 123—and in 88 of those cases, only the landlord’s attorney appeared; the landlord did not attend the hearing personally. The disparity is stark: tenants appeared pro se 99.3% of observed cases, while landlords were represented in 86.6%. In a courtroom where the stakes are a family’s housing, one side had counsel and the other did not.
Representation in 142 observed cases
Hearing Length
Most observed hearings lasted less than 10 minutes. In a proceeding that determines whether a household loses its home, the typical hearing was shorter than a commute. For a tenant without a lawyer, a 10-minute hearing is not enough time to understand the process, let alone present a defense.
What Volunteers Saw:
Volunteers recorded qualitative observations alongside the quantitative data. Three patterns appeared repeatedly.
Tenants asked for more time. Many tenants requested a continuance; more time to pay, to find a lawyer, or to understand what was happening. Some were granted, many were not.
Tenants tried to negotiate directly with the landlord's attorney. These conversations often happened in the hallway before the hearing: about a payment plan, a repair issue, or extra time (and often without any record of what was agreed upon). In most represented cases, the landlord did not appear personally; only their attorney did. A tenant who wants to negotiate with the person who owns their home may find that person is not in the room.
Tenants lost on procedure, not substance. Eviction cases run on strict rules about filing the right forms, making the right arguments, and presenting evidence at the right moments—procedural steps that unrepresented tenants often miss.
One tenant arrived ten minutes late after getting off work and found the judgment already signed and stamped. In those ten minutes, everything she had come to tell the judge went unheard: the failed inspection, the move already underway.
In another case, the tenant was in the courthouse but had been directed to the clerk’s office instead of the courtroom; by the time the error was sorted out, a default judgment had been entered, and she had to file a motion to set it aside.
A third filed a motion to set aside judgment (a stage after the point where most legal help arrives) and drew an extraordinary response from the judge:
“The judge told a single mother that her motion to set aside a judgment was the single best filing that he had ever seen a pro se tenant write. Apologetically he explained that because she filed the wrong form, by law, he had to grant possession to the landlord.”
What the court watch establishes
Volunteers also observed what happens when tenants try to find a lawyer mid-case. In one July hearing, two tenants appeared with a young toddler, asked for legal counsel, and disputed their landlord’s filing. The judge granted a two-day continuance and referred them to Legal Services of Southern Missouri and Access Justice, a self-help center on the first floor of the courthouse that provides forms assistance and information, but cannot represent anyone in court.¹⁹
At the follow-up hearing, they still had no attorney. Possession was granted.
A referral is not representation, and two days is not enough time to secure it. Eviction court, for tenants without lawyers, is not a forum they can meaningfully participate in.
This is the gap that Right to Counsel is designed to close.
City Council Participation
STUN invited all nine City Council members to observe a court watch shift. Three accepted: Brandon Jenson (Zone 3), Monica Horton (Zone 1), and Bruce Adib-Yazdi (Zone 4).
“I saw compassion from the judge who sometimes noted that he regretted the outcome that he was required to provide under the law. That just really struck me a couple of times that folks may not know how to navigate the system and so you have to follow the law as the judge and your hands can be tied.”
“Ordinary citizens do not have the representation [and] you can see a lot of imbalance of power.”
“A landlord or property manager’s job description includes showing up for court. The tenant has a job that they probably have to take off work for. There’s some inequity in that aspect of it.”
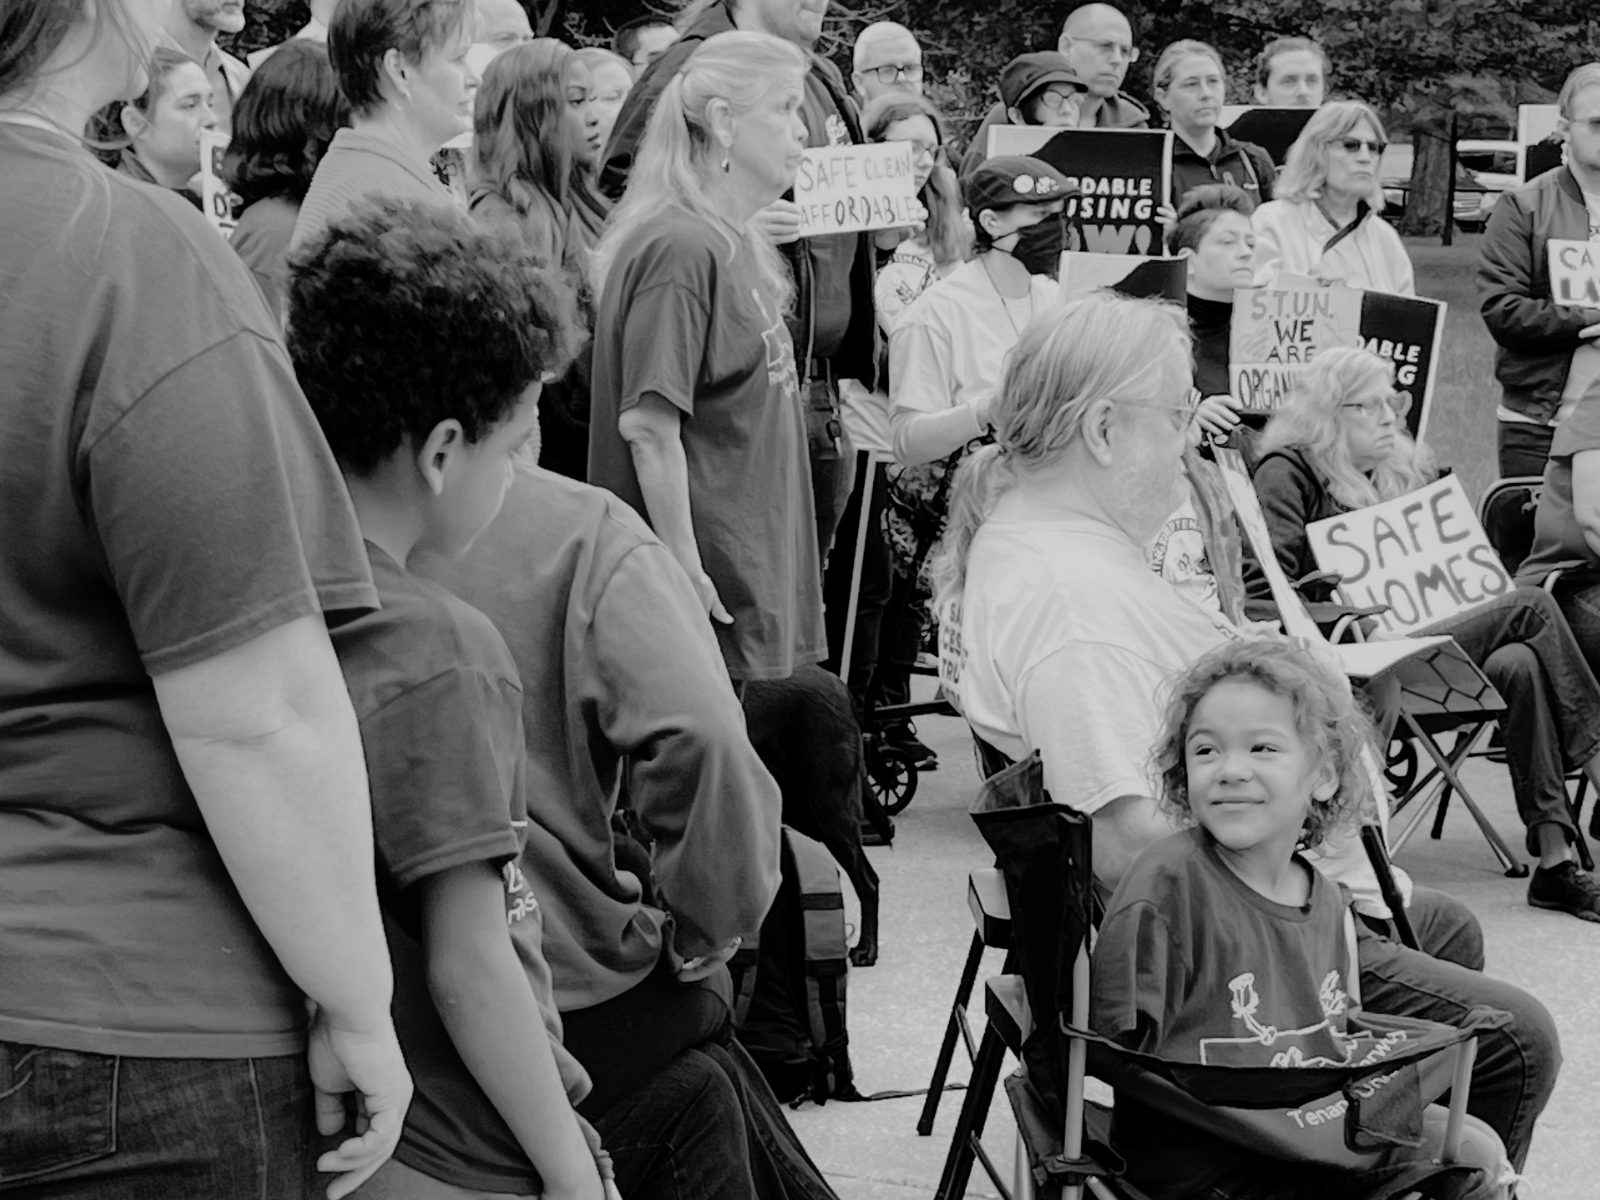
STUN Court Watch Program findings show a system in which tenants are overwhelmingly under-resourced and alone.
Section III: CaseNet Data
Methodology: Court Watch
When: May 19, 2026 - September 1, 2026
Where: Greene County circuit court, Springfield, MO
Who: STUN-trained community volunteers
How cases were selected: Volunteers attending hearings based on their availability. Cases were not randomly sampled.
What was recorded: Presence or absence of legal representation for both parties, approximate hearing duration, and qualitative notes on the proceedings.
What this data is and isn’t: The findings describe what occurred in the 142 cases volunteers observed. They are not a statistical estimate of all eviction cases filed in Springfield during the period. The court watch was designed to document how eviction court functions for unrepresented tenants, not to produce a representative sample. It is, however, to our knowledge, one of the few detailed accounts.
Case types observed: 135 Rent and Possession, 7 Unlawful Detainer
How cases end
Nearly one in three cases (32.94%, 957 cases) ended in default judgment. A default does not mean the tenant had no defense—it means that the tenant was not present to raise one. These cases are not the population an RTC program can directly serve, but they are not outside its reach. As Kansas City’s experience shows, outreach and navigation before the hearing can reduce the number of tenants who default.
More than a third of cases (37.97%, 1,103 cases) were dismissed by the parties. This suggests that many filings are resolved through negotiation or voluntary dismissal. But without data on the terms of those dismissals, we cannot know whether tenants received adequate time to relocate or agreed to terms under pressure.
Only 5.03% of cases (146 cases) went to trial. This low trial rate is consistent with the court watch finding that hearings are brief and procedural. Most cases never reach a substantive hearing on the merits.
Consent judgments (18.49%, 537 cases) fall between these categories. A consent judgment is an agreement between the parties, and tenants without counsel may agree to terms (payment plans, move-out dates, money judgments, etc) that they do not fully understand or cannot meet.
Rent owed at filing
STUN analyzed the amount of rent tenants owed in cases that ended in default and consent judgments. Trials, dismissals, and other dispositions are excluded because the amount owed is not consistently recorded.
The analysis covers 392 cases from May through September 1, 2026. Of those, 126 have been verified and calculated; the remainder are pending or could not be verified.
More than half of verified cases (56%) involved tenants who were only one month behind on rent at the time of filing. Another 29 cases (23%) involved tenants two months behind. Only 15 cases (12%) involved tenants four or more months behind. These are short-term crises, not chronic nonpayment—and short-term crises are exactly what rental assistance, payment plans, and legal intervention are designed to address.
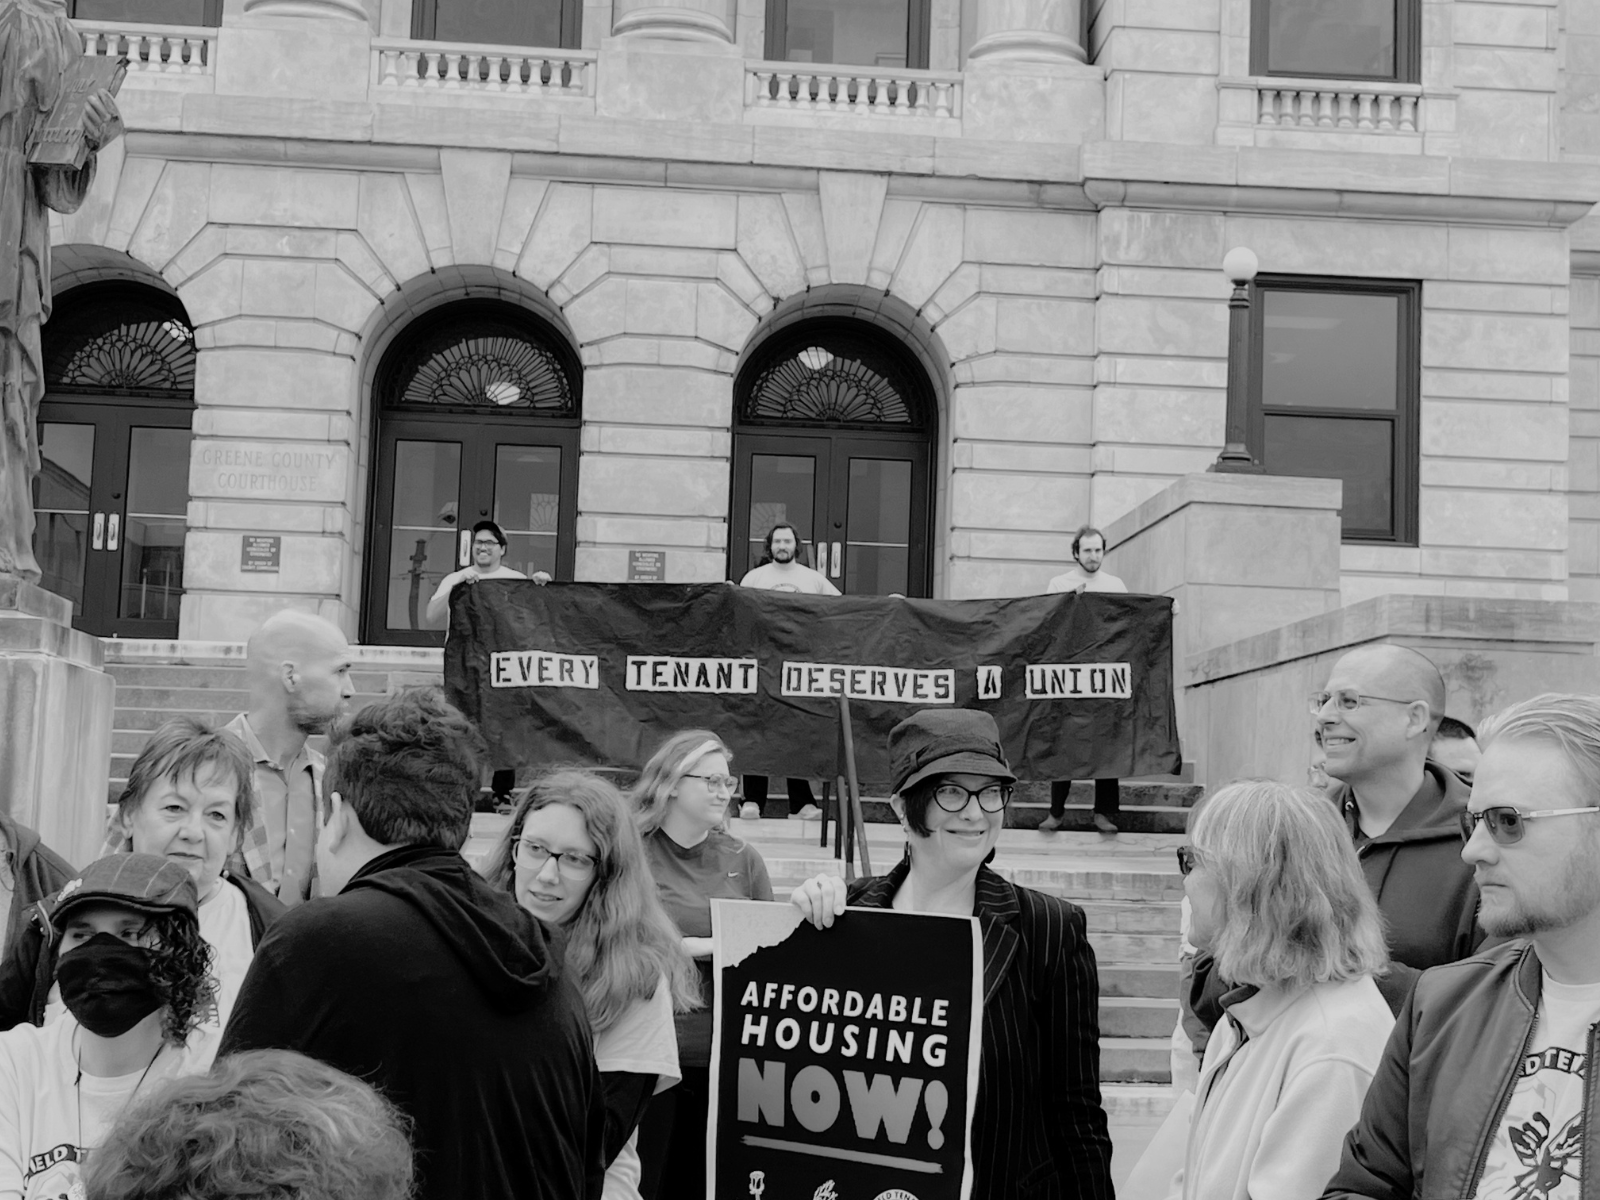
More than half of verified cases (56%) involved tenants who were only one month behind on rent at the time of filing.
Section IV: Right to Counsel
What Right to Counsel is
Right to Counsel (RTC) guarantees legal representation for income-eligible tenants facing eviction. A tenant who qualifies gets a lawyer—a qualified professional who can appear in court, file the correct forms, raise defenses, negotiate with the landlord’s attorney, and explain the process to the tenant in plain language.
RTC is not a guarantee against eviction. It is a guarantee of representation. A tenant with a lawyer may still lose if the landlord has a valid case. But the tenant will have had a fair chance to present their side. For tenants who appear, representation means their defenses get raised, the fees get challenged, and the procedural traps described in Section II stop deciding cases before the tenant’s side is heard. And by reaching tenants before the hearing, RTC reduces the number who default in the first place.
What Right to Counsel is not
It is not a bar on eviction. RTC does not prevent landlords from filing or from recovering possession when a tenant has no legal basis to remain. It ensures that eviction cases are decided on their merits, not whether a tenant knew which form to file.
It is not a zero-sum contest between tenants and landlords. RTC can benefit landlords by increasing the likelihood of negotiated agreements, payment plans, and voluntary move-outs—outcomes that are often faster and more cost effective than a contested hearing or a default judgment followed by an eviction on a tenant’s record. In Cleveland, Nashville, and Kansas City, RTC programs have been evaluated as returning more in public savings than they cost.
It is not limited to the poorest households. Eligibility varies by program, by RTC is typically available to tenants at or below a set income threshold, often 80% of Area Median Income or 200% of the Federal Poverty Level. A household at 80% AMI in Springfield earns roughly $73,100 for a family of four—enough to be ineligible for many anti-poverty programs, but not enough to hire a lawyer for an eviction case on short notice.
The evidence from other cities
This report examines published data on RTC programs in five cities: Kansas City, Cleveland, Nashville, Louisville, and Toledo. Cleveland and Nashville have independent cost-benefit evaluations; Kansas City has a peer-reviewed study; Louisville and Toledo report program outcomes.
Kansas City (adopted in June 2022). A study published in the Journal of Urban Affairs found that Kansas City’s RTC program reduced the probability of default judgment and the probability of eviction judgment. Comparing case outcomes before and after implementation, the study found that default judgments fell from 45.9% to 37.5% and eviction judgments fell from 60.7% to 50.9%.²⁰
Cleveland (adopted July 2020). Stout’s evaluation found that Cleveland’s program returned $2.47 for every $1 invested between July 2020 and December 2025, and that 85% of clients avoided disruptive displacement. (21)
Nashville/Davidson County (adopted pilot July 2022). Stout's evaluation found that 93% of clients receiving extended services—full or extensive representation, as opposed to advice or limited action—avoided disruptive displacement, keeping 370 households stably housed, and that the program generated a total financial return of $4.18 for every dollar invested in 2025. (22)
Louisville (adopted April 2021). Louisville was the first city in the South to enact RTC. In its 2024 Q4 data, 99% of tenants who received extended representation either delayed or avoided eviction, and 97% either avoided or delayed their eviction with enough time to find alternative housing. A legal aid society report found that 1,515 children were prevented from becoming homeless as a result of the program. The program was initially limited to households with children at 125% of FPL, but the ordinance was later amended to remove the child requirement, expanding eligibility.²³
Toledo (adopted September 2021). Toledo’s program, operated by Legal Aid of Western Ohio, serves tenants at or below 200% of the Federal Poverty Level. In its first year of implementation, 88% of closed cases (122 of 139) successfully avoided eviction, keeping 177 adults and 190 children in their homes. But Toledo’s funding has not been sustained: the city cut the program's annual allocation from $250,000 to $67,000 in April 2026, reducing its caseload from roughly 250 households a year to 98 cases—even as eviction filings reached a six-year high. (24)
None of these programs eliminated eviction. All five demonstrated that representation changes outcomes: Cleveland and Nashville have also published cost-benefit analysis showing public savings that exceed program costs: $35.1 million in benefits against $14.3 million in expenses in Cleveland, and $4.3 million in fiscal benefits against $1.8 million in spending in Nashville.
The evidence across all five cities point to the same conclusion: representation changes the trajectory of an eviction case, and the public savings can exceed the cost of the program.
How a Springfield program would work
Program structure. The program would be administered by a Tenant Legal Services Coordinator within the city, a position included in the Year 1 budget at $80,000. The Coordinator would contract with qualified legal services providers, oversee caseload caps, facilitate data sharing with the 31st Judicial Circuit, coordinate intake, and report annually to Council.
Legal representation would be provided by contracted agents: organizations selected through the city's procurement process, open to legal aid organizations, private firms, and solo practitioners. Representation would be full-scope, by a Missouri-licensed attorney, from the filing of the petition through dismissal or final judgment, including appeals or trial de novo where the attorney believes appropriate.
A Tenant's Right to Counsel Committee would provide oversight. The report recommends a committee with a majority of covered tenants (individuals who do not own property and are not associated with housing profit motives), plus non-voting members from the City Council, the Continuum of Care, a tenants' organization, and the court clerk. The committee would review the annual report, advise on program rules, and meet quarterly in public.
Eligibility. The program should cover tenants at or below 80% of Area Median Income facing a covered proceeding is any action seeking removal of a residential tenant, including nonpayment of rent, holdover, retaliatory eviction, or ejectment.
Triage. Not every tenant needs full litigation. The contracted provider would screen each tenant at intake and assign a service level: advice or brief services for cases that can be resolved simply, full representation for cases facing trial, or complex defenses. Cleveland’s program prioritizes extensive services for tenants with disabilities, imminent homelessness risk, or defective housing conditions.²⁵ Springfield should add a fourth factor: two or more eviction filings against the same household at the same property. Nashville’s 2025 caseload was 48% advice, 38% extended services, and 13% limited action²⁶. The Coordinator would set the screening framework and collect data on how cases are distributed. The per-case cost in Section V reflects the average across service levels, not the cost of full litigation for every tenant.
Notice requirement. Any entity filing an eviction against a covered tenant should be required to provide written notice of the program to both the tenant and the property owner. Failure to provide the notice should result in dismissal of the eviction case in favor of the tenant. This responds directly to the default problem described in the executive summary: a tenant who does not know the program exists cannot access it.
Retaliation protections. No property owner should be permitted to retaliate against a tenant receiving legal representation—by failing to renew a lease, altering terms, shutting off utilities, or charging the tenant the owner's filing fees unless included in a settlement or court order. Violations should carry an administrative fine of no less than $1,000 per day per covered individual.
Reporting requirements. The Tenant Legal Services Coordinator should submit an annual report to the City Council by September 1, published on the city's website. The report should include:
The number of covered individuals who participated in a covered proceeding
Demographics, including zone of residence, household size, presence and age of children, race and ethnicity, income, tenancy length, and housing authority status
Outcomes, including dismissals or decisions for the tenant, judgments for possession, stipulations preventing judgment, stipulations allowing later vacate, additional time to vacate, back rent reduced or waived, and eviction executions
Instances of serial filings on the same individual or household at the same property
Client satisfaction survey results
An annual estimate of required expenditures
Rental assistance. The program should be paired with a rental assistance component. Kansas City's ordinance states the mechanism directly: "Right to Counsel attorneys successfully utilize federally funded rental assistance programs as leverage to negotiate more favorable outcomes for tenants facing eviction."²⁷ When those federal funds expired, Kansas City replaced them with a locally funded $940,000 program.²⁸ Cleveland's evaluation found that the absence of sufficient rent assistance makes it harder for attorneys to resolve cases that lack a strong legal defense.²⁹
The Year 1 cost for the full program, including the Tenant Legal Services Coordinator, is $702,057, plus $97,943 for rental assistance: a total of $800,000.
The Year 1 rental assistance fund should cap each household at one month's rent (approximately $1,095). At that level, the remaining $97,943 could assist roughly 89 households—about 70% of the families with children in the program’s caseload. Households with arrears beyond one month would be connected to other rental assistance programs where available, with the attorney helping coordinate the application and advocate for the tenant. A household two or three months behind may still face a gap, and the availability of other rental assistance is limited: the large federal pandemic-era funds that once supported Springfield tenants have been exhausted, and the ongoing city, state, and philanthropic programs are small, competitive, and not guaranteed. The one-month limit stretches the Year 1 fund to reach more families, but it does not eliminate the gap. The fund should scale in Year 2 as the program grows and the city has a better sense of demand.
Cost models. The table below shows three cost models for a Springfield program at full implementation (Year 5). All three share the same legal representation cost, scaled to the full caseload of 1,260 tenants. The Year 1 budget and rental assistance described above reflect Model B at partial scale—the model STUN recommends.⁰ ¹ ² ³ ⁴ ⁵ ⁶ ⁷ ⁸ ⁹
| Model A: Core | Model B: Core & Family Rental Assistance | Model C: Core & Universal Rental Assistance | |
|---|---|---|---|
| Tenants represented | Y1: 252 Y5: 1,260 |
Y1: 252 Y5: 1,260 |
Y1: 252 Y5: 1,260 |
| Legal representation | Y1: $702,057 Y5: $3.01M |
Y1: $702,057 Y5: $3.01M |
Y1: $702,057 Y5: $3.01M |
| Rental assistance | Y1: $0 Y5: $0 |
Y1: $97,943 Y5: $700,000 |
Y1: $275,000 Y5: $1.38M |
| Total annual cost | Y1: $702,057 Y5: $3.01M |
Y1: $800,000 Y5: $3.71M |
Y1: $977,000 Y5: $4.39M |
Rental assistance estimates assume one to two months of arrears at Springfield's FY2026 Fair Market Rent of $1,095 for a two-bedroom unit. Model B assumes roughly half of tenants are households with children, based on national Eviction Lab research³⁰. Model C assumes rental assistance for all tenants. These are planning estimates, not a costing exercise.
Model A is legal representation only. It addresses the representation gap documented in Section II, but without rental assistance, attorneys may be unable to resolve cases where the tenant has no legal defense and owes back rent.
Model B is legal representation plus rental assistance targeted to families with children. It directs the resource to the households where the downstream consequences are steepest: school disruption, child welfare involvement, homelessness, and where national data shows the highest eviction risk. This is the model STUN recommends.
Model C is legal representation plus rental assistance for all tenants. It is the most effective at resolving cases, but roughly twice the cost of Model B.
The tradeoff: Model B leaves tenants without children who are behind on rent without the rental assistance that makes representation most effective. That is a prioritization choice, not a claim that other tenants do not need help; if the family-targeted fund proves effective, the program can be expanded to Model C in a future budget cycle.

Right to Counsel (RTC) guarantees legal representation for income-eligible tenants facing eviction.
Section V: Cost of Doing Nothing
The fiscal argument for Right to Counsel does not rest on the cost of the program alone. It rests on the cost of the alternative. When an eviction proceeds without representation, the public pays—not once, but repeatedly, through emergency shelter, health care, law enforcement, and child welfare. City Council and the public should ask not whether Springfield can afford an RTC program, but whether Springfield can afford to keep paying for the consequences of unrepresented eviction.
What eviction costs the public
The most recent Springfield-specific estimate places the annual public cost of one unsheltered adult at approximately $30,597 in policing, cleanup, municipal court fees, and medical expenses.³¹ At Springfield’s January 2025 Point-in-Time count of roughly 588 individuals, that represents about $17.6 million annually in downstream costs.
Eviction is a leading cause of homelessness. A study published in Quarterly Journal of Economics found that eviction increases emergency shelter use and homelessness in the two years after filing.³² National research has also found that each additional eviction per 100 renter-occupied homes is associated with a 1.6% increase in foster care placements, and Missouri spends approximately $25,000 annually per child in foster care.³³ ³⁴ The same QJE study found that eviction reduces tenants’ quarterly earnings by 8% in the year after filing, growing to 14% in the second year.³⁵
Many of these evictions are avoidable. Section III found that most tenants facing eviction in Springfield are only one month behind on rent.
The fiscal comparison
STUN’s cost model projects that representing eligible tenants would cost approximately $2,786 per case in Year 1, declining to $2,386 by Year 5, for an annual cost of $3.01 million at full implementation.
If even 10% of the 1,260 tenants represented each year would otherwise experience homelessness, that is 126 people. At $30,000-$40,000 per chronically homeless person per year, the downstream public cost would be $3.78 million to $5.04 million—exceeding the program’s annual cost. At 5%, the downstream cost is $1.89 million to $2.52 million, roughly two-thirds to five-sixths of the program cost. These figures count only homelessness avoided. They do not include the child welfare, earnings, Medicaid, or criminal justice savings documented in Sections III and IV.